PV Performance data for modelling available generation in Distribution Network Operator areas
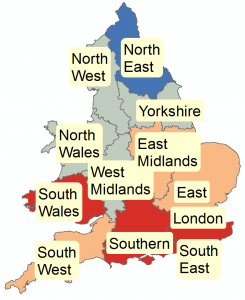
The spreadsheets available for download below contain hourly values for 2005-2014 for each of 12 UK Distribution Network Operators for the following parameters: Air Temperature deg.C., Global Horizontal Irradiance (G0) Wh/m^2, In-plane irradiance (due south, 22 deg. Tilt) G.POA Whm^2, Module Temperature deg. C. (Tmod), kWh/kWp. Installed Capacity of Solar Farms 2015 (MWelec) and Overallenergy MWh.

Downloads
North Wales, Merseyside and Cheshire
NOTE: Higher spatial resolution data is available upon request mailto:juice-centre@lboro.ac.uk
Data analysis
Location of solar farms and domestic installations compared to solar resource and population distribution.
UK solar farm and population maps
Data preparation
Installed capacity of solar farms is for 2015 from:
https://www.gov.uk/government/publications/renewable-energy-planning-database-monthly-extract.
The meteorological and energy data is calculated from UK Meteorological Office measured values as described in publications:
- Palmer et. al. “The UK Solar Farm Fleet: A Challenge for the National Grid?”
- Palmer et. al. “Interpolating and estimating horizontal diffuse solar irradiation to provide UK-wide coverage: selection of the best performing models.”
- Koubli et. al. “Inference of missing data in photovoltaic monitoring datasets.”
Data usage
If you make use of this data, please:
- E-mail mailto:juice-centre@lboro.ac.uk with details of your employer/institution and a brief description of the project for which you require the data.
- Cite this journal paper in any publications.
- Feel free to link this webpage and the journal papers to any relevant online resources.
